 |
 |
 |
Using its selective subset procedure, TableCurve 3D will fit 36,000 of the over 450 million built-in equations or just the ones you need — instantly. With TableCurve 3D, a single mouse click is all it takes to start the automated curve fitting process — there is no set up required! You can even enter your own specialty models to be fit and ranked along with the built-in equations. TableCurve saves you precious time because it takes the endless trial and error out of curve fitting. |
 |
Click to View Larger Image
|
Fit User-Defined Functions
|
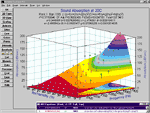
Up to 15 user-defined equations can be entered and ranked along with the built-in equations. These specialized models can contain most mathematical constructs, including special functions, series convergence and conditional statements, differentiations, integrations and parameter constraints.
TableCurve 3D even offers the option of graphically adjusting equation parameters to assure convergence for the fit of user-defined models. Unlike most surface fitting programs, TableCurve 3D’s user-defined functions are compiled so they can be fitted at nearly the speed of the built-in equations. For maximum flexibility, TableCurve 3D gives you the option to save your functions as individual files, in libraries or both.
|
Visually Discover the Best Equation to Model your Data :
|
| Graphically Review Surface Fit Results |
| |
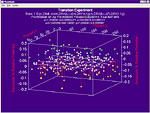
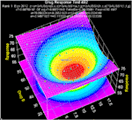
Once your XYZ data have been fit, TableCurve 3D automatically sorts and plots the fitted equations by the statistical criteria you select (r2, DOF adjusted r2, Fit Standard Error or the F Statistic). Graphically review the fitted results as you scroll through the equation list. A 3D residuals graph as well as parameter output are generated for each fitted equation. Add confidence or prediction intervals to the graph to detect outliers in your data. You can also automatically display a 2D contour plot on the top and bottom of the surface fit graph to get another view of your data. Data, statistical and numeric summaries are also available from within the Review Surface Fit window so you can further analyze fit results. |
 |
Click to View Larger Image
|
Viewing a surface fit from all angles is imperative in determining whether or not a given fit is accurate. Using a simple interface, TableCurve 3D lets you view a graph from any angle. It will even animate the graph automatically in a specified XY and/or Z angle sequence. Just sit back and observe every nuance within the fit. TableCurve 3D gives you all of the tools you need to discover the model that best meets your requirements for the ideal fit.
|
Flexible Output Options
|
Output TableCurve 3D’s publication-quality graphs in black and white or color, portrait or landscape. You can also produce files containing data and equations in Lotus, Excel, ASCII, Quattro Pro and SigmaPlot formats. TableCurve 3D can speed up your programming by generating actual function code and test routines for all fitted equations in FORTRAN, C, Basic and Pascal. |
With All This Power, it’s Still Easy to Use!
|
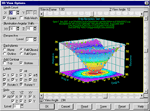
TableCurve 3D takes full advantage of the Windows graphical user interface to simplify every aspect of operation — from data import to output of results. Import data from many popular file formats including SigmaPlot, Excel, Lotus, SPSS and ASCII. Once your data are in the TableCurve editor, start the automatic fitting process with a single mouse click. Choose to fit all equations, select a group of equations or create a custom equation set. All equations are readily available from the Toolbar or TableCurve’s Process Menu. You can even set up TableCurve 3D to begin fitting the moment data are imported or modified with Background Thread Processing Fitting. Users consistently comment that — out of the box, without reading the instructions — TableCurve is highly intuitive, easy-to-use and remarkably simple to learn. |
|
Click to View Larger Image
|
Eliminate Tedious Data Analysis Chores with TableCurve 3D
|
TableCurve 3D is the first and only program that combines a powerful surface fitter with the ability to find the ideal equation to describe three dimensional empirical data. TableCurve 3D uses a selective subset procedure to fit 36,000 of its 453,697,387 built-in equations from all disciplines to find the one that provides the ideal fit – instantly! What once could take days of tedious work now takes minutes, with a much more powerful result. |
|
Click to View Larger Image
|
TableCurve 3D Solves Complex Science and Engineering Problems Faster
|
- Optimize product and process performance
- Quickly calibrate sensors
- Understand complex chemical kinetics
- Reduce empirical data to a simple equation
- Stabilize systems with dynamic feedback
- Any general surface-fitting application
|
|
|
TableCurve 3D’s fitting speed is impressive, but so are the extensive results it provides. Once the fit is complete, TableCurve presents you with a statistically ranked list of the best fit equations. You are given all of the information you need to choose the equation that best meets your requirements for the ideal fit. Once you have selected the best fit equation, output high-quality function and test programming code. You can also generate comprehensive reports as well as publication-quality graphs. And, TableCurve 3D easily transfers data and equations to and from all popular Windows applications, including Excel. No other fitting program offers this much versatility and power.
|
Need 2D data-fitting capabilities?
|
TableCurve 2D fits and ranks almost 3,665 built-in equations to your data in seconds. TableCurve 2D/’s comprehensive data, statistical and numeric summaries combined with its publication-quality 2D graphs give you the power to quickly and easily find the best model for your XY data.
|
Model exotic data sets
|
For those rare equations that cannot be adequately managed by a parametric model, TableCurve 3D offers advanced non-parametric procedures for gridded and scattered data. For gridded data, five state-of-the-art true algorithms are included, the main ones being the tensor product splines. For scattered data, eight different algorithms are available. TableCurve 3D also offers the Fill Sparse Grid option is generally used for grid-based data with incomplete elements, as occur with incomplete sampling, from the removal of outliers, and from the deliberately sparse design of experiments matrices. If you need to generate exact interpolated data on a uniform grid, possibly to constrain parametric fits in regions lacking data, the Interpolate Uniform Grid option offers an automatic solution. |
